In my last post, we have studied the basics of Google Chart. Google Charts helps us display the dry-data in a very beautiful visualization.
If you look around the web, you’ll find that there is a lot of buzz about Google charts but there are not many tutorials which demonstrate how to use Google Charts. So I came up with this tutorial.
In this tutorial I will share how to create time user graph using Google Charts , PHP and MYSQL. Here are the steps :
- Load the Google Charts AJAX api:
jsapi. - Load the Visualization API Library and add package name
corechart. - Then, set google callback function and call `getData()` function which will fetch data from the database.
- In the
getData()function, we will retrieve an array of data and will push the data in thedrawChart()method. - In the
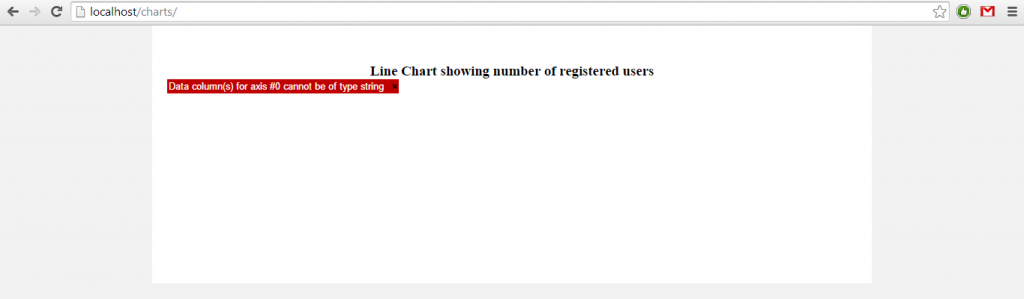
drawChart()method, we will push the array data to tables and will draw line chart with the data.
For this tutorial we will be using a DB table as a data source. The table contains users and their date of registration. Here, we will display the number of registered users on a particular date. Lets start with the tuorial: